Quantcast
Channel: ArcGIS Blog » mosaic dataset
Viewing all 22 articles
Browse latest View live

Synchronize your mosaic dataset to remove your broken links

$
0
0

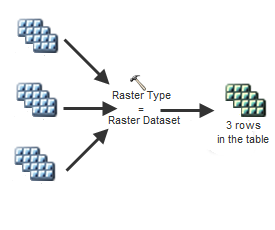
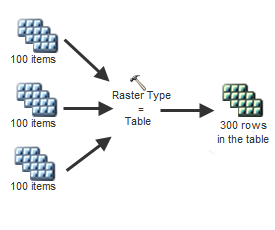
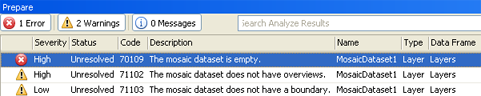
A mosaic dataset contains references to datasets from a file system. Whenever the datasets being referenced by a mosaic dataset are moved to some other location, the references within the mosaic dataset are broken. You can handle such broken items by either repairing the path to the current location of the dataset or by removing the broken references from the mosaic dataset.

The Repair Mosaic Dataset Paths tool or the Repair Mosaic Dataset window can be used to repair the path of the broken mosaic dataset items pointing to the current location of the dataset.

Alternatively, you can remove your broken paths while you synchronize your mosaic dataset.

How to remove your links
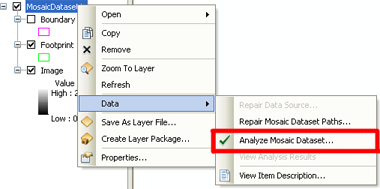
The “Synchronize Mosaic Dataset” tool can be used to remove broken items from a mosaic dataset. This tool can be launched from System Toolboxes -> Data Management Tools -> Raster -> Mosaic Dataset toolset.
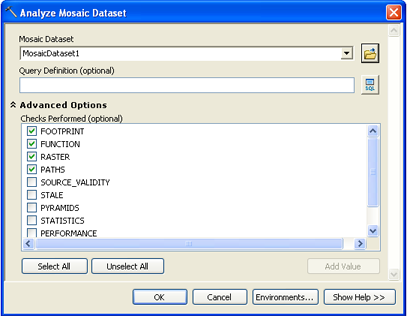
1) In the Synchronize Mosaic Dataset tool, check on “Remove Items with Broken Data Source” to remove the items that have broken data links.
2) Uncheck “Update Existing Items” so that we update any existing items.
3) Make sure that “Update with New Items” is checked off, so that no new items are added.
4) Expand the Mosaic Dataset Options arrow.
5) Make sure all three options here are unchecked: “Update Cell Size Ranges”, “Update Boundary”, and “Update Overviews”.

Synchronize Mosaic Dataset

TIP: You can get a list of broken items within a mosaic dataset by using the “Export Mosaic Dataset Paths” tool with “Export Mode” set to BROKEN.

Submitted by: Saravanan Muthukaruppan


Does your mosaic dataset look like a checkerboard?

$
0
0

Do any of your mosaic dataset items have a checkerboard pattern? If this is the case, it means that there is a problem accessing your mosaic dataset items.

Any failure in opening a mosaic dataset item will result in a checkerboard pattern within your mosaic dataset item display. Previously they used to be displayed as grey. This will occur for both source mosaic dataset items and also for overviews as well.

A failure opening an item usually occurs if the file is missing, or if you do not have read permissions to the location.

To solve this issue, you will need to point your mosaic dataset to an existing file that you have access to.

Clip, Zip and Ship your image service, using Python

$
0
0

Here is a Python sample that can be used to clip items from your image service, package them into a mosaic dataset with all the metadata field values, and then ship them to a client or colleague. As with all other code samples that we add to our gallery, it is meant to help show you how something can be done in code; the actual implementation may need some altering in order for it to work for your particular example.

Description:
This python sample application accepts a input image service layer or URL as input. You can draw a polygon feature to define an area on the image service that you want to clip.

The program will start creating a local mosaic dataset with all metadata field recovered from the image service. And then it will download the image service item one by one according to the geometry of the polygon, and clip the image using the polygon.

You also have the option to clip the image using the default raster function if there is any. And you can also define the output image’s cell size.

The downloaded image will be added back to the local mosaic dataset along with all the metadata field values from the image service.

Note:
This python scripting tool uses the 10.1 Image Server REST API. Some of the functionality, such as define output image spatial reference in the ExportImage REST request is not available in 10.0. This is only a sample, and you may need to alter it, order for it to work for your particular case.

Submitted by: Jie Zhang

Tips for Color Balancing a Mosaic Dataset

$
0
0

color correctedArcGIS has the ability to color balance mosaic datasets. Color balancing is not a new feature, but we thought we would advocate a few tips for when you color balance.

  1. Color balancing is a data specific problem. If possible, try the various balancing options and choose the one that works for you.
  2. The Dodging method usually gives better results. There are 5 different color surfaces you can try within the Dodging method.
  3. If the images dramatically vary in color due to land cover variety, try to use the surface type of color grid.
  4. Using a target raster has a substantial influence on the result, choose the target carefully, especially when there are land cover differences between mosaic dataset and target.
  5. Using the high level overview of the mosaic dataset as target for color correction can keep the original color.
  6. If using a mask and/or a target, make sure they can cover all your images.
  7. When using an external target, stretching images may help color correction.

A color-balanced world Landsat imagery can be found here.

Happy color balancing!
Hua Wei

Should I build pyramids or overviews?

$
0
0

This is a very common question that many users ask. First let’s take a look at what each of these, and when they are needed.

Pyramids
Pyramids are reduced resolution datasets. They let you perform dynamic mosaicking and on-the-fly processing quickly, even at smaller scales with little effect on performance. Pyramids are built for primary (source) rasters that are on disk. `Viewing and processing these raw rasters on-the-fly can be time-consuming at small scales, therefore we build pyramids for this reason.

Overviews
Overviews are similar to pyramids in the sense that they are reduced resolution images created to optimize your mosaic dataset for performance and increase display speeds. However, the biggest distinguishing factor here is that the overviews are not created per raster. Each overview is derived by mosaicking multiple primary rasters. Since each overview was derived from multiple rasters, it takes a static view of the mosaic dataset at the time you generate overviews. Creating overviews will mean that the dynamic mosaicking capabilities are not longer available.

Pyramids versus Overviews

When are pyramids per mosaic dataset item needed
You should consider building pyramids when you are building more complex mosaic datasets, especially where you will be taking advantage of the mosaic methods and on-the-fly processing, then it will be advantageous to build pyramids on the source rasters and to build overviews only where they are needed.

When are overviews needed in a mosaic dataset
You should consider building overviews when you are working with: tiled images, preprocessed images, butt-joined (non-overlapping) imagery, basically imagery that wont be really affected by changing mosaic methods. But one thing to keep in mind, overviews do not retain the primary rasters metadata.

Contributed by: Vinay Viswambharan

Is your mosaic dataset inflating your file geodatabase? Shrink it.

$
0
0

Does your mosaic dataset have a lot of images (ten or hundreds of thousands)?
Are you using a 10.0 file geodatabase to manage your mosaic dataset?
Do you make frequent and massive data transactions and manipulations?

If you answered “yes” to all these questions, then there is a chance that the size of your file geodatabase on disk has increased exponentially and has become quite inflated.  This is due to a common problem of any database system – fragmentation.

No need to panic
The solution to this problem is to run the Compact geoprocessing tool periodically on your file geodatabase. This tool will rearrange how the geodatabase is stored on disk, and will usually reduce its size, and improve its performance.

Compact GP tool

How about in 10.1?
In ArcGIS 10.1, this inflation is far less noticeable, because mosaic dataset uses the out-of-line storage. This means that any mosaic dataset that is within a file geodatabase created in 10.1 will not have a large inflation due to constant data transactions. Therefore you should consider migrating your mosaic dataset to a 10.1 created file geodatabase. Simply create a file geodatabase in ArcGIS 10.1, then copy and paste your mosaic dataset into it.

Is Compact obsolete in 10.1?
It is still a good practice to run the Compact tool occasionally in ArcGIS 10.1. It will only make a small difference after massive data manipulation, but it will still keep your file geodatabase organized neatly and running optimally.

Contributed by: Hua Wei

Should I cache my mosaic dataset?

$
0
0

Whether you build cache or not, mainly depends on how you will use the mosaic dataset.
If you are going to serve out your imagery collection for non-analytical purposes or as a backdrop, then creating cache is recommended. This applies to cases where you do not need the actual pixel values, on-the-fly processing capabilities, or dynamic mosaicking capabilities.

Cache is highly optimized and involves just retrieving pre-processed tiles as requested by a client, with no intermediate processing or resampling. This means that clients accessing your cached data will have a very fast response time.

Cache on demand
You can serve out an image service with dynamic cache – in which case, cached tiles will be generated when an area is hit for the first time. So the first access will be slow, but all subsequent access to that same area of interest will very fast.

Image Service Cache
As well, we’ve added a new functionality in ArcGIS 10.1. Instead of having to embed a mosaic dataset within a map service to cache the map service, you can now consume a single image service as either a cache or a dynamic image service. This can be achieved both within Desktop and also through web clients.

NOTE: All cache tiles are created as 8-Bit RGB.


Submitted by: Vinay Viswambharan

Managing categorical rasters in ArcGIS Workflow

$
0
0

Categorical raster management has been greatly enhanced at ArcGIS 10.1. Multiple rasters that have the same classification scheme can be ingested in a mosaic dataset, share one attribute table and colormap, can be published as a single image service, and can be used as a single dataset.  Below is a workflow of how to achieve this.

1.    Use Create Mosaic Dataset tool to create a new mosaic dataset

  • Specify the mosaic dataset name
  • Specify the mosaic dataset coordinate system
  • Expand the Pixel Properties section
  • Set “Number of Bands” = 1

2.    Set Thematic as the Source Type, on the Mosaic Dataset Properties page:

  • In the Catalog Window, right-click your newly create mosaic dataset, and click Properties
  • On the General tab, switch Source type to “Thematic” and then Apply
  • On the Defaults tab, make sure the default compression is either “None” or “LZ77”.  It may be a good idea to remove “JPEG” and “LERC” from Allowed Compression Methods;
  • Also on the Defaults tab, change default resampling method to “Nearest Neighbor”
  • Click Apply

3.    Use Add Rasters to Mosaic Dataset tool to add categorical data into the mosaic dataset

  • Specify the mosaic dataset
  • Keep the Raster Type as Raster Dataset
  • Navigate to the Workspace that contains all your categorical data
  • Click OK to run the tool

4.    In some cases, source rasters may have NoData pixels around the edge (usually 0 or 255) that needs to be filtered out – use the Define Mosaic Dataset NoData tool.

  • Specify the mosaic dataset
  • In the Band for NoData Value dropdown, choose Band_1
  • Specify the NoData value for band 1 (most likely 0).
  • Click OK to run the tool

5.    Use the Calculate Statistics on the mosaic dataset. This will give mosaic dataset statistics and histograms.
6.    Add the Attribute table function

  • In the Catalog Window, right-click on the mosaic dataset, and click Properties
  • Click on the Functions tab
  • Insert “Attribute Table function” on top of “Mosaic function”, and point to a raster attribute table file (.dbf). A “raster attribute table” contains pixel value and category name mapping that you can show in legend, with “OID”, “VALUE”, “COUNT” fields and optional “Red”, “Green”, “Blue” and class type columns that ArcGIS will recognize and use to symbolize when display.
  • If no DBF exists, then you will need to build a raster attribute table  (not covered in this particular blog)

7.    Use the Build Overviews tool to create overviews
8.    Optionally you can publish the mosaic dataset as an image service. The raster attribute table, statistics and histograms will be streamed by the image service through its SOAP and REST APIs along with categorical imagery. You can use unique value and classified renderers on both the mosaic dataset and the image service.

Important notes:
Please note the raster value attribute table is used by the mosaic dataset but not stored in the mosaic dataset. So whenever you need to move the mosaic dataset, you need to go to mosaic dataset’s function tab to point to the correct/accessible raster attribute table location.
Also please keep in mind, ArcGIS Server account need access to mosaic dataset, source rasters, and the raster attribute table.


Contributed by: Wenxue Ju


How does a mosaic dataset handle rasters in different projections?

$
0
0

The spatial reference of a mosaic dataset is specified when you create it (using the Create Mosaic Dataset tool). This spatial reference is used to manage all of the data that is ingested into your mosaic dataset. As always, re-projections are performed on-the-fly by the system.

Therefore ArcGIS handles the various projections for you.

One aspect of the spatial reference you do need to worry about it which coordinate system is specified to manage your mosaic dataset. The spatial reference or the extents of the data you are ingesting into your mosaic dataset should fall within the horizon of the mosaic datasets spatial reference extent. Any data that falls outside of the spatial reference will not display. Therefore a safe approach will be to use a spatial reference that is large- such as Mercator or WGS 1984.

Submitted by: Vinay V.

How does a mosaic data handle with different geographic transformations?

$
0
0

Last week’s blog dealt with how a mosaic dataset handles different projections. In response to that blog, there were several of users that then wondered how a mosaic dataset handles data with different geographic transformations.

In order for a mosaic dataset to properly handle data with various transformations, you will need to specify all the geographic transformations that the mosaic dataset needs to accommodate.

How do you specify a geographic transformation?

1) In the ArcMap Catalog Window, right-click on the mosaic dataset, and click on Properties.

2) Click on the Defaults tab.

3) Scroll to the bottom of the window.

4) Click on the ellipsis button (…), which is beside Geographic Coordinate System Transformation. Define geographic transformations

5) Check if the geographic transformation that you need is populated in the list.

6) If it is not there, choose a geographic transformation that is relevant to the data in your mosaic dataset and click the Add Item (plus sign).choose gographic transformation

7) If all the geographic transformations have been set, then click OK to accept your specified transformations.

Written by: Simon W.

Why can’t I use the mensuration tools on my imagery?

$
0
0

In order to be able to use the mensuration tools your imagery, ArcGIS needs the sensor model information and/or sun angle information – depending on which type of measurement you trying to do. Typically, processed or tiled imagery such as NAIP or DOQQs do not contain this information, and therefore you can’t make measurements on these images.


mensuration requirements
My image has the proper metadata but still cannot be used with the mensuration tools

Now if you have all the required information and you have ingested your imagery into a mosaic dataset and you notice you can’t measure heights, it is likely because your mensuration capabilities have been turned off on your mosaic dataset or your image service.

You can enable mensuration for a mosaic dataset by adjusting the mensuration capabilities within the Mosaic Dataset Properties window, under the General tab.
You can enable mensuration for an image service by editing the Image Service Properties.

edit mensuration capabilities for a MDedit mensuration capabilities for an IS

Deleting a mosaic dataset properly

$
0
0

Like any other data type, you can delete a mosaic dataset by right-clicking on it within the Catalog window, and choosing Delete. However this simply deletes the mosaic dataset from the geodatabase. All of the associated files and tables that are related to this mosaic dataset (such as overviews of the mosaic dataset and the item cache) are not deleted.

How do I delete a mosaic dataset and all its related files?

Starting at ArcGIS 10.1, the Delete Mosaic Dataset geoprocessing tool was introduced that provides an option to delete the overviews of the mosaic dataset and the item cache  associated with every item of the mosaic dataset.
Delete mosaic dataset

This tool can be launched from the geoprocessing toolbox (Data Management Tools -> Raster -> Mosaic Dataset toolset) or by choosing “Delete All” from the “Remove” context submenu.
GPTree Delete MD   Delete All conext menu

NOTE: Since a referenced mosaic dataset does not have its own overviews or item cache, these options are disabled.

Submitted by: Amit Jain

“No editable layers” when trying to edit the footprint table within a mosaic dataset

$
0
0

This blog is based on a true story from a forum post.  Hopefully it will help others that have the same issue.

Problem: I have created a mosaic dataset and added a raster in it. Then I opened the attributes table and clicked on Start Editing in Editor toolbox. It is giving me the error that there are “No editable layers”.

Is your Mosaic Dataset stored in SDE?

Solution:  If so, you will have to register the footprint layer as versioned. Add the mosaic dataset is added to ArcMap, you can run the Register As Versioned geoprocessing tool and select the ‘Footprint’ layer.

Scanned Map template – Working with CADRG/ECRG data in a mosaic dataset

$
0
0

Esri has compiled and uploaded a Scanned Map Template to ArcGIS.com. The Scanned Maps Template is designed to teach you how to add military scanned map data in CADRG/ECRG format to mosaic datasets.

The Scanned Maps template is part of the basemap category of ESRI defense templates. Basemaps are designed to help you more quickly get your bearings in your map. The Scanned Maps template and the walk-through exercise in the accompanying “Using the Scanned Maps template” document are designed to teach you how to add military scanned map data in CADRG/ECRG format to mosaic datasets, and how to publish the mosaic datasets to ArcGIS for Server 10.1, using ESRI recommended practices. Mosaic datasets are new at version 10 of ArcGIS and are the recommended data type for storing CADRG/ECRG data in ArcGIS.

Submitted by: Natalie Campos

Using tiled images with coordinates stored in a table

$
0
0

There’s a lot of tiled imagery out there that gets delivered to people without any coordinates stored with the files. Often the coordinate information exists but it’s stored in a table. So how do you view it in ArcGIS.

Well, if it’s just one or two images you can create a world file for each image. To learn how to do this, see World files for raster datasets.

But in many cases it’s 100 or 1000s of images and generating a world file for every file may be a bit daunting without some automation. So the best way to deal with this in ArcGIS is to create a mosaic dataset and add the images to it using the Table raster type.

Your table must have the following fields–using these field names. The order of the fields doesn’t matter.

Raster, Xmin, Xmax, Ymin, Ymax, NCols, NRows, PixelType, NBands

The Xmin, Xmax, Ymin, and Ymax fields are the coordinates of the image extents.

The Raster field is the path and name of the image. Such as c:\data\Image01.tif.

The NCols and NRows are the dimensions of the image (the number of columns and rows).

The Nbands field is the number of bands in the image. Such as, 3 for a color image and 1 for a grayscale image.

The PixelTypefield is a number identifying the bit depth of the pixel. The supported pixel types are:

  • -1: Unknown
  • 0: 1-bit
  • 1: 2-bits
  • 2: 4-bits
  • 3: Unsigned 8-bit integers
  • 4: Signed 8-bit integers
  • 5: Unsigned 16-bit integers
  • 6: Signed 16-bit integers
  • 7: Unsigned 32-bit integers
  • 8: Signed 32-bit integers
  • 9: Single precision floating point
  • 10: Double precision floating point
  • 11: Single precision complex
  • 12: Double precision complex
  • 13: Short integer complex
  • 14: Long integer complex

You can also add other fields, such as a date or other identifiers for the imagery if you want. I often add an ImageName field that contains just the name of the image.

Next, create your mosaic dataset. Then open the Add Rasters To Mosaic Dataset tool, pick Table from the Raster Type dropdown and click the Properties button.

Make sure the Raster Source is Raster (the same Raster field in your table), and if you have a field for the image name you can enter it.

Click OK to close this dialog box and in the tool dialog box, add your table as the Input Data. Click OK and your collection of tiled images will be added to the mosaic dataset.


Table or Raster Data – which Raster Type is correct for a derived mosaic dataset

$
0
0

A derived mosaic dataset is a mosaic dataset that is created from adding other mosaic datasets into it. When populating a derived mosaic dataset, it is okay to use either the Raster Dataset or Table as your raster type. The raster type chosen will load your data in a slightly different way.
derived mosaic dataset

If you add your source mosaic datasets as a Raster Dataset raster type, each mosaic dataset is added as one row within your derived mosaic dataset. This means that if there were 3 source mosaic datasets, then only 3 rows will appear within your derived mosaic dataset.
Raster type as Raster dataset

If you add your source mosaic datasets as a Table raster type, then your derived mosaic dataset will add each item from the source, as its own row. This means that if there were a total of 300 mosaic dataset items within the source mosaic datasets, there will be 300 rows within your derived mosaic dataset.
Raster Type as Table

Is your mosaic dataset doing okay?

$
0
0

Is there something wrong with your mosaic dataset?  Or are you wondering if it can be optimized? Have you tried analyzing your mosaic dataset?
The Analyze Mosaic Dataset tool that can be performed on a mosaic dataset to help you find any errors or warnings that may be associated with your mosaic dataset. Think of it as a check-up for your mosaic dataset.

How do I find this tool?
In the Table Of Contents (TOC), right-click the mosaic dataset (parent level), point to Data, and click Analyze Mosaic Dataset.
Analyze mosaic dataset context menu

This brings up the Analyze Mosaic Dataset tool.
Analyze mosaic dataset tool

How do I use the tool?
1) In the Analyze Mosaic Dataset tool, the input mosaic dataset should already be populated. If not, navigate to the correct location.
2) Expand the Advanced Options. By default only Footprint, Function, Raster, and Paths are going to be examined. Feel free to check on or off any of the options.
3) Click OK to run the tool.
Once the tool completes, the Prepare window will appear (assuming you followed the steps above on a mosaic dataset that has never been analyzed). The Prepare window will show you the Error, Warnings, and Messages that the tool has diagnosed.
analyze results window

Now what?
Now you can review the list of errors and warnings, and then decide if you want to fix your issues. Errors should be fixed, since they tend to prevent a mosaic dataset from working properly. Warning can optionally be fixed; they tend to diagnose ways to improve the performance on your mosaic dataset.

To learn more about each issue, highlight an error or warning, right-click on it, and choose Help. This will bring up the Help topic that describes this issue.
Help context menu for error message

If a tool can be fixed by running a Geoprocessing tool, double-click on the issue will bring up the appropriate tool.

Broken Image Service Layers on ArcGIS Server for Linux

$
0
0

If you create a mosaic dataset in a file geodatabase on a Windows machine, and then copy it over to a Linux machine, your paths within the mosaic dataset will be incorrect.

To publish the Windows mosaic dataset as an image service on an ArcGIS Server that runs on a Linux machine, there are two possible solutions. Before embarking on either of these workflows, you need to have the source images on both the Windows and Linux machines, and you need to verify their consistency.

Manually path fix

  1. On your Windows machine, create a new folder. In that folder, create a new file geodatabase with the same name as your existing file geodatabase. Make a copy of your mosaic dataset here.
  2. On the new mosaic dataset, repair the paths of source rasters with the proper Linux paths.
  3. Copy the new file geodatabase (containing the repaired mosaic dataset) to the Linux machine,
  4. Register the folder to your ArcGIS Server:
    1. Using a publisher or administrator connection to the ArcGIS Server, right-click Server Properties.
    2. Click the Data Store tab.
    3. In the Registered Folders section, click on the Add button
    4. manual fix - add button

    5. In the Register Folder window, type a name for your registered folder.
    6. manual fix - register folder

    7. Make the publisher folder path the Windows path. This is the path of the parent folder of the mosaic dataset on the Windows machine.
    8. Uncheck the Same as publisher folder path box.
    9. Make the server folder path the Linux path. This is the path of the parent folder of the mosaic dataset on the Linux machine.
    10. Click OK in the Register Folder window and the ArcGIS Server Properties window.
  5. Now you can publish the image service on the Linux machine.

Automatic path fix by publisher

  1. Register the folder to your ArcGIS Server
  2. automatic fix - add button

    1. Using a publisher or administrator connection to the ArcGIS Server, right-click Server Properties.
    2. Click the Data Store tab.
    3. In the Registered Folders section, click on the Add button.
    4. automatic fix - register folder

    5. In the Register Folder window, type a name for your registered folder.
    6. Make the publisher folder path the Windows path. This is the path of the source images on the Windows machine.
    7. Uncheck the Same as publisher folder path box.
    8. Make the server folder path the Linux path. This is the path of the source images on the Linux machine.
    9. Click OK in the Register Folder window.
  3. Make sure the mosaic dataset’s parent folders are not registered in data store. Publisher/Server folder path pairs mean they have identical set of data on client and server machines. It’s publisher’s responsibility to keep them correct. In this workflow, there is no suitable mosaic dataset on the Linux server so we don’t want to misguide ArcGIS Server.
  4. Now you can publish the image service on the Linux machine.
    Since mosaic dataset’s path is not in data store, the publishing process will package the mosaic dataset and send it to the Linux machine. The publishing wizard will check source rasters in the mosaic dataset against data store, and since they all exist, source rasters are not copied to Linux in the process.

Manual vs. Automatic
After seeing the 2 methods, most users will probably opt for the automatic method. However there are a few advantages to the manual method:

  • It is faster, especially for large amounts of imagery, since you only need to repair the paths once instead of multiple repairs in automatic workflow. (The automatic method repairs once on client, and then again on the server).
  • Your mosaic dataset will be managed from your specified location, instead of the arcgisinput folder (which is the data management location that ArcGIS Server sets).
  • If you are serving a “live mosaic” that has backend scripts constantly adding new images to the mosaic dataset without republishing, then the manual method is the only way to achieve this.

Improve your scientific analysis with one simple trick!

$
0
0

When we talk about scientific data, the term is kind of a catch-all that really refers to three data formats commonly used in the scientific community: NetCDF, HDF, and GRIB. If a normal raster is a grid where each block is pixel that has a value, these data formats have at least one more dimension (such as a vertical or time dimension) and can store data for many attributes at a given location. If this needs clarification, just ask in the comments and I’ll figure out another way to explain this stuff.

Anyway, there’s a ton that you can do with these kinds of datasets. The raster team has been working to make ArcGIS compatible to read and analyse this type of data within our mosaic dataset. To get you started, check out this package of goodies on ArcGIS Online that has step by step instructions for:

  • Analyzing categorical data from MODIS
  • Visualizing vegetation
  • Displaying an RGB composite
  • Using a QA/QC band to create masks
  • Extracting variables from modeled weather datasets such as GLDAS and NLDAS
  • Aggregating hourly or daily data into monthly totals
  • Deriving the heat index and wind chill from temperature, wind and humidity data
  • Displaying ocean currents as vectors (No, not a shapefile… nope, not disease vectors either…but something with a magnitude and a direction. OK, fine. It’s an arrow.)

Also, I would be remiss if I didn’t mention our github repo. This is the place to go to if you want to create custom raster functions. If you can script in Python, you can pretty much do anything (like, you could probably build and launch a satellite in python if you actually know what you’re doing). Anyway, at the repo you can learn all about the basics of what functions can and cannot do, and how they work really well for the kinds of datasets I’m talking about here.

Create rectangular features using their geographic extents

$
0
0

By Aileen Buckley, PhD, Esri Research Cartographer

Create Envelopes thumbnail

Have you ever needed to create rectangular features that are defined by their geographic extent? This script tool can help you speed up that process by automatically creating the polygon features using an input file with the north, south, east, and west extents. The Create Envelopes script tool was developed to create polygon features for the mapped areas of scanned map images—we call these features envelopes. While this tool was developed for a particular workflow, it can be used to create any set of regular polygon features if the bounds of the polygons are known.

For the scanned map images, the envelopes align with the map neatline (the edge of the mapped area) and do not include the map collar (the area that contains the marginalia, such as the scale bar and north arrow). The envelopes are created as polygons in the output feature class.

Create Envelopes tool

The envelopes are defined using the bounding coordinates in an input (metadata) table. The metadata table must be in geodatabase format. For this tool, the metadata table should contain a unique ID for each polygon feature to be created, along with north, south, east, and west coordinate values for each feature’s extent. As shown in the figure below, these should be a double field type (that is, double-precision floating-point number).

Metadata table example

With this tool, you can set the coordinate system to be used for the bounding coordinates. This is a very important step because if incorrectly defined, the envelopes won’t line up with the edges of the map. For example, geographic coordinates at the corners of a US Geological Survey (USGS) topographic map, as shown at the upper left in the figure below, may use a NAD 83 datum, as shown in the middle of the figure. This information is generally displayed on authoritative maps such as topographic maps in a national map series. For other maps it may be harder to determine and a trial-and-error basis may be required to lead to the correct definition.

Setting the coordinate system

When this tool is finished running, the output feature class is added to the map.

Envelopes added to the map

If necessary, the rectangular features can then be modified into more complex shapes using the standard editing tools.

Edited envelope

This tool was developed to support the workflow associated with creating historical map collections and sharing them online. Keep an eye on this blog to find out more about when the documentation for that workflow, and associated downloadable resources, will be available. The documentation will include step-by-step instructions for using this tool and the download will include sample data that you can use to test out the workflow and this tool.

Thanks to Steven Lambert, Esri, for writing the code for this tool!

Viewing all 22 articles
Browse latest View live